Bitcoin Market Recap: Overnight Flush With All Eyes on the NY Open
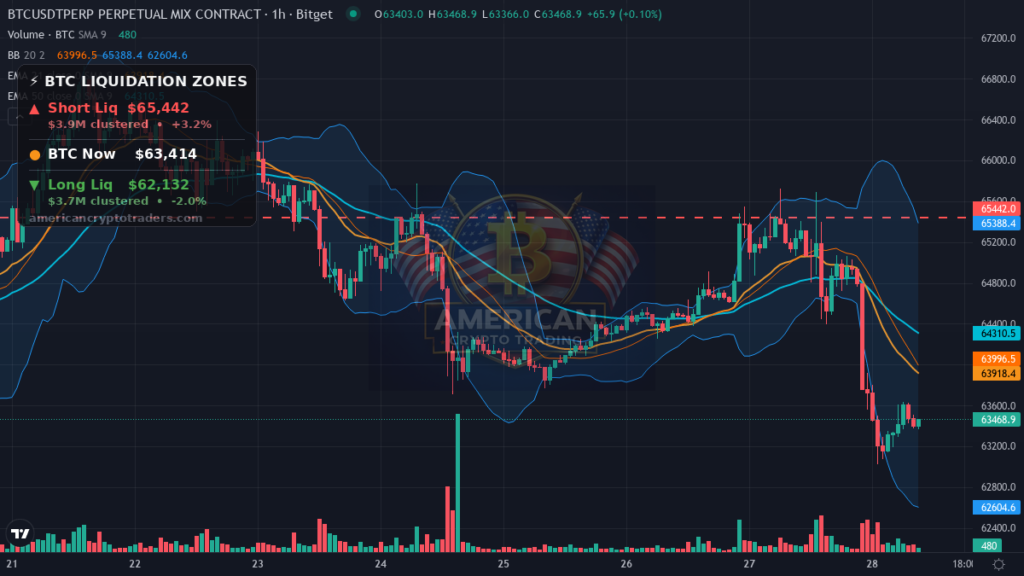
As we gear up for the New York session, Bitcoin currently sits at $63,465, down 2.66% over the past 24 hours after overnight selling pressure drove price from a $65,693 high all the way down to a $63,023 low. The damage was broad, with altcoins taking a harder hit than BTC and total market cap shedding roughly $62 billion in the process. The question heading into the NY open is straightforward: does this flush find a floor, or does continuation pressure follow when U.S. desks arrive?
What Moved Markets Overnight
A Minnesota judge temporarily blocked the state’s prediction market ban, handing a short-term legal win to Kalshi and Polymarket. The ruling directly reduces the regulatory overhang that had been hanging over the onchain prediction sector, which had faced the prospect of material U.S. state-level restrictions. While one judge’s temporary block is not a final ruling, it removes an immediate operational threat and keeps these platforms accessible to U.S. users for now — a modest but real sentiment tailwind for the broader DeFi-adjacent space.
Lido announced an upgrade targeting a one-third reduction in Ethereum’s active validator count, introducing a significant structural shift in ETH’s staking dynamics. Fewer validators means a leaner, more consolidated staking ecosystem, which can affect how ETH supply circulates through the network — validators that exit must wait out the withdrawal queue, creating a temporary lockup effect before that ETH re-enters circulation. This kind of structural change can be a slow-burn positive for ETH supply mechanics, but in a risk-off overnight session the market appeared to price it as noise, with ETH underperforming at -3.9% to $1,882.92.
Gold fell 0.78% overnight to $4,042.80, underscoring a cautious macro backdrop that offered no tailwind for risk assets including crypto. When gold and crypto both decline simultaneously, it typically signals broad de-risking rather than a crypto-specific selloff — money is moving toward cash or short-duration instruments rather than rotating between stores of value. The DXY held almost flat at 101.53, the S&P 500 futures showed no change, and the 10-year Treasury yield was pinned at 4.64%, leaving crypto without a macro catalyst to lean on heading into the morning.
Altcoin Action
The altcoin tape overnight was ugly across the board, with most major names posting larger percentage losses than Bitcoin — a sign that BTC dominance firming to 56.4% is not an accident. Ethereum dropped 3.9% to $1,882.92 after touching a 24-hour high of $1,977.23, with the Lido upgrade news failing to stem the selling. SOL fell 3.84% to $73.39, losing the $77 handle it had briefly held, while DOGE shed 3.23% to $0.0701.
The real carnage was in the smaller names. SHIB was the headline loser among majors, crashing 10.8%, while BEAT led all losers down 18.5% and VVV dropped 9.2%. On the other side of the ledger, the gains were thin and scattered — HASH managed a 3.1% rise, MORPHO added 1.6% — but in a market-wide flush of 2.69% in total cap, there were very few places to hide. Funding rates on ETH have flipped negative at -0.000017, suggesting short positioning is building in that pair specifically.
Positioning and the Liquidation Map
The liquidation map provides a clean picture of where the mechanical pressure sits on both sides of the current price. With BTC trading near $63,414, the short liquidation cluster sits at $65,442 — a 3.2% move higher from here. If NY buyers show up with conviction and push through that level, approximately $3.92 million in short positions would be force-closed, which could amplify any rally into a fast short squeeze that overshoots fair value.
On the downside, the long liquidation level sits at $62,132, roughly 2.0% below current price and representing about $3.72 million in leveraged long exposure. A break below the overnight low of $63,023 that extends to $62,132 would trigger a cascade of long liquidations, adding mechanical selling on top of any fundamental pressure and potentially accelerating a move toward the next structural support zone. The risk is asymmetric in the sense that the upside liq cluster is larger in dollar terms, but the path of least resistance currently favors testing the downside first given overnight momentum.
BTC funding sits at a near-neutral 0.000039, indicating the market is not yet aggressively positioned in either direction on perpetuals — consistent with a market that just flushed and is waiting for a directional cue from U.S. hours.
The Macro Picture
The macro environment entering today’s session is best described as inert with a cautious tilt. The S&P 500 futures showed zero change overnight, the 10-year yield held at 4.64%, and the dollar was essentially flat. None of these readings scream systemic stress, but none of them are providing a tailwind either. A 4.64% 10-year yield remains restrictive enough to keep risk appetite measured, and with gold slipping rather than rallying, there is no obvious safe-haven rotation story supporting crypto valuations this morning.
The absence of major macro catalysts on today’s calendar cuts both ways — there is no obvious positive trigger to spark a recovery, but there is also no scheduled event that could worsen the picture. Price action into the NY open may be driven more by technical levels and positioning mechanics than by fundamental news flow.
Levels to Watch
Into the NY open, the immediate line in the sand is the overnight low at $63,023. A hold above that level on any early dip would be the first signal that sellers are tiring and a relief bounce is possible. Above the market, the first meaningful resistance to reclaim is the $64,500 area before the larger short liquidation cluster at $65,442 comes into play.
On the downside, a clean break below $63,023 opens a path toward the long liquidation cluster at $62,132. Below that, traders should watch the $61,500 zone as the next structural area of interest. ETH holding above $1,865 — its 24-hour low — and SOL defending $72.80 would be supportive secondary signals that the broader market is stabilizing rather than accelerating lower.
Upcoming Catalysts
The economic calendar appears quiet for today’s session with no high-impact macro events present in the current data — price action will likely be driven by technical levels, positioning dynamics, and any further regulatory headlines following yesterday’s Minnesota prediction market ruling.
Sentiment Check
The Fear & Greed Index reads 29 — Fear, a level that historically marks the territory where short-term relief bounces become possible as capitulation sellers exhaust themselves, though it does not guarantee an immediate reversal. Contrarian readings in the Fear zone are worth tracking alongside our 28-for-28 monthly candle analysis for broader cyclical context. With total market cap sitting at approximately $2.26 trillion after the overnight flush, the market is pricing in real uncertainty — not panic, but genuine caution.
Bottom Line
Bitcoin heads into the New York session at $63,465 after a clean overnight flush from $65,693 to a $63,023 low. The altcoin tape was worse, dominance firmed, and the macro backdrop offered no help. The setup is binary: either NY buyers step in near the overnight low and begin building toward the $65,442 short liquidation cluster, or continued selling pressure breaks $63,023 and invites mechanical long liquidations toward $62,132. Sentiment at Fear 29 suggests the pain trade could be a relief bounce, but the first hour of U.S. trading will tell the story. Watch the levels, size accordingly, and let price confirm direction before committing.
Disclaimer: This recap is for educational and informational purposes only and does not constitute financial advice. Cryptocurrency trading involves substantial risk of loss. Always do your own research. American Crypto Traders and its contributors may hold positions in the assets discussed.