Bitcoin Market Recap: Post-Midterm Risk-Off Sends BTC to $73K
As we gear up for the New York session, Bitcoin currently sits at $74,265, down 2.09% over the past 24 hours after a sharp overnight selloff drove price from $76,160 highs all the way down to a session low of $73,408. The move was broad, deliberate, and rooted in several converging macro and regulatory headwinds that have yet to fully resolve heading into the NY open.
The total crypto market cap dropped 5.12% on the day to approximately $2.47 trillion, with Bitcoin dominance climbing to 60.2% — a classic sign that capital is rotating out of risk-on altcoins and into the relative safety of BTC, or simply exiting crypto altogether. When dominance rises in a down market, it typically means alts are bleeding faster, not that Bitcoin is being bought.
What Moved Markets Overnight
Bitcoin ETFs logged $1.3 billion in weekly outflows — the largest since late June. This is not noise. Weekly outflow figures of this magnitude signal that institutional participants are actively reducing exposure, not simply rotating. When spot ETF demand flips negative at scale, it removes a key price-support mechanism that the market leaned on heavily during 2024 and early 2025. With these outflows heading into the NY open, the burden falls on retail and derivatives markets to hold the line — a fragile setup at best.
Nvidia’s board opened an internal investigation after reports surfaced that CEO Jensen Huang was the target of a Chinese espionage effort. The headline sent shockwaves through AI and chip-related equities, and the turbulence spilled directly into crypto. Markets have increasingly priced AI-adjacent narratives into token valuations, and anything that rattles confidence in the AI trade creates a reflexive risk-off impulse across correlated assets including Bitcoin and high-beta altcoins. Chip sector volatility is not a crypto story on its own, but in today’s macro-linked environment, it absolutely moves crypto books.
Binance, Tether, and Trump-affiliated crypto firms are facing a Senate records deadline, resurfacing regulatory overhang at a vulnerable moment. The timing is particularly damaging. When spot demand is already soft and ETF flows are negative, regulatory headlines act as a multiplier on fear rather than a manageable headwind. Traders who might otherwise buy the dip are sitting on their hands, waiting to see whether this escalates into enforcement action or remains procedural. That uncertainty itself is a price suppressant.
Altcoin Action
Ethereum is bearing the brunt of the altcoin selloff, dropping 5.65% to $2,107.72, with its 24-hour range spanning $2,056.99 to $2,245.54. ETH underperformance relative to BTC in a risk-off environment is a familiar pattern — it tends to amplify moves in both directions, and right now that amplification is working against holders. Solana fell 3.31% to $86.14, touching a low of $84.92 intraday, while DOGE shed 2.81% to $0.0688.
On the ugly end of the leaderboard, RAIN dropped 15.3%, PI fell 12.3%, and PEARL slid 9.7% — the kind of double-digit losses in lower-liquidity tokens that often accompany a broader de-risking wave. When institutional money exits via ETF redemptions, the selling pressure cascades from large caps down into mid and small caps as leveraged positions unwind across the board.
Not everything bled out, however. ARB gained 4.9%, RENDER added 4.1%, and PEPE picked up 3.8% — each driven by isolated, token-specific flows rather than any macro tailwind. These moves stand out precisely because they ran counter to the tape, suggesting targeted accumulation or protocol-specific catalysts rather than a broad recovery in risk appetite. Don’t mistake a few green candles for a turning tide.
Positioning and the Liquidation Map
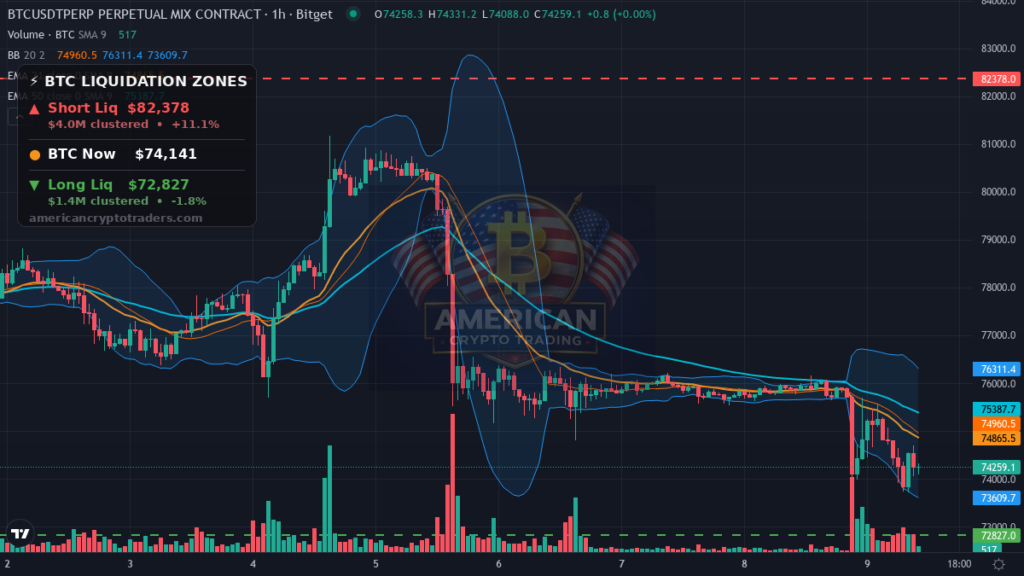
With Bitcoin currently trading near $74,141 per the liquidation map data, the positioning picture is asymmetric and worth watching carefully into the NY open. On the downside, long liquidations cluster at $72,827, representing approximately $1.36 million in leveraged long exposure. A clean break below that level would force additional long liquidations, likely accelerating selling pressure and opening the door to a faster flush toward the $71,000–$72,000 range.
On the upside, short liquidations sit at $82,378 — roughly 11.1% above current price — with about $4.0 million in short exposure stacked there. A rally to that level would trigger a cascade of short squeezes, but that’s a significant distance from here and would require a meaningful catalyst to materialize when NY desks arrive. For now, the market is closer to the long-liquidation trap than the short one.
BTC funding rates remain marginally positive at 0.0092%, and ETH funding has essentially collapsed to near zero at 0.0002%. The near-zero ETH funding suggests that levered long enthusiasm has already been largely washed out in that market — which can paradoxically reduce the downside velocity if sellers have already done their work overnight.
The Macro Picture
The U.S. 10-year Treasury yield climbed to 4.86%, up 0.45% — a meaningful move that tightens the screws on risk assets across the board. When yields push toward the upper end of their recent range, the opportunity cost of holding volatile, non-yielding assets like crypto rises, and institutional allocators rebalance accordingly. This dynamic has been a persistent headwind for digital assets throughout 2026.
The DXY held steady at 101.83 with no notable change, and gold was flat at $4,107.60. The S&P 500 futures are showing a modest +0.31% at 7,376.86, which provides a slightly constructive backdrop for equities but has not translated into crypto confidence — likely because the ETF outflow and regulatory stories are crypto-specific negatives layered on top of the broader macro pressure from yields.
Levels to Watch
Going into the NY session, the immediate line in the sand is $73,408 — the overnight low. If NY buyers show up and defend that level convincingly, it could establish a short-term floor for a relief bounce attempt. Below that, $72,827 is the long-liquidation trigger and represents the next meaningful area of risk. A break there would shift the narrative from orderly pullback to accelerating flush.
To the upside, watch $76,160 — the top of the overnight range. Reclaiming that level on volume when NY desks arrive would signal that the overnight sellers have been absorbed. Beyond that, the $78,000–$79,000 zone served as prior support-turned-resistance and would be a more meaningful recovery hurdle. The $82,378 short-liquidation cluster is the moonshot level for bulls — material, but distant given current sentiment.
Upcoming Catalysts
The economic calendar is relatively quiet for the session ahead, leaving price action likely to be driven by ongoing ETF flow data, any further developments in the Senate records deadline for Binance and Tether, and any follow-through from the Nvidia board investigation story if new details emerge. With no scheduled high-impact macro releases, the tape may trade on sentiment and technicals more than fundamentals into the afternoon.
Sentiment Check
The Fear & Greed Index sits at 29 — Fear. That’s a meaningful step down from the neutral zone and reflects the combined weight of post-midterm uncertainty, institutional ETF redemptions, regulatory headlines, and macro rate pressure. Historically, readings in the high-20s have coincided with capitulation-adjacent behavior, though fear alone is not a buy signal without a price catalyst to anchor a reversal.
For a longer-term perspective on how monthly candle structure interacts with market cycle positioning, our 28-for-28 monthly candle analysis remains one of the cleaner macro frameworks for understanding where we are in the broader trend — worth revisiting in a week like this one.
Bottom Line
The overnight session delivered a clear message: post-midterm risk-off is real, institutional flows are moving against crypto via ETF redemptions, and regulatory headlines are suppressing buy-side confidence at a moment when price is already fragile. Bitcoin holding above $73,408 is the minimum requirement for bulls to maintain any near-term narrative. A break below $72,827 opens the liquidation cascade, while any recovery attempt needs to clear $76,160 to mean anything structurally.
When NY desks arrive, watch the opening volume carefully. A low-volume drift lower is different from a high-volume defense at the lows — the former signals continued disinterest, the latter might indicate institutional accumulation quietly building a position into the fear. For now, the data says stay cautious, manage size, and let the market show its hand before committing directionally.
Disclaimer: This recap is for educational and informational purposes only and does not constitute financial advice. Cryptocurrency trading involves substantial risk of loss. Always do your own research. American Crypto Traders and its contributors may hold positions in the assets discussed.