Bitcoin Market Recap: BTC Holds Range While Crypto Decouples From the Stock Surge
Today’s bitcoin market recap tells a story of divergence. The S&P 500 ripped 2.35% higher to 7,549.94 on macro optimism ahead of tomorrow’s CPI release, but that bullish energy never crossed the aisle into digital assets. Bitcoin closed the New York session near $74,975, down 0.93% on the day, after printing a 24-hour range between $73,408 and $75,720. When equities rally sharply and BTC still fades, it is a signal worth taking seriously — the sector is carrying its own headwinds that broad risk appetite cannot paper over right now.
Total crypto market cap dropped 3.03% to roughly $2.52 trillion, meaning the damage was broader than Bitcoin’s modest slip suggests. Altcoins absorbed the real pain while BTC dominance climbed to 59.6%, the clearest sign that whatever capital is staying in crypto is consolidating around the largest asset as a relative safe haven.
What Moved Markets Today
The $6.3 billion Binance hack continued to cast a shadow over sentiment. Elliptic analysts flagged that North Korean-linked wallets have begun minting Elon Musk and animal meme coins as a laundering mechanism to fragment and obscure the stolen funds. While analysts broadly downplayed systemic contagion risk, the optics are damaging — a nine-figure hack with an active, creative laundering operation running in real time is not a backdrop that invites fresh institutional capital. Confidence remains soft, and that softness is showing up in spot volumes and price action across the board.
The S&P 500’s 2.35% surge failed entirely to lift crypto, exposing a meaningful decoupling. In a traditional risk-on environment, BTC would be expected to rally alongside equities or at minimum hold flat. Instead it drifted lower, suggesting the sector is pricing in its own specific concerns — hack aftermath, regulatory overhang, and a leveraged market still digesting the aftermath of recent volatility. When the correlation breaks to the downside like this, it generally reflects elevated caution among crypto-native participants who are not simply following macro flows.
AVAX carved out an exception thanks to a high-profile NYSE tokenization deal, illustrating just how selective and narrative-driven flows have become. While the broader altcoin complex bled out, capital rotated into AVAX on the specific catalyst of institutional validation from one of the world’s most recognized exchange brands. This is not a broad risk-on trade — it is a thematic trade. The fact that one narrative headline can lift a single asset while everything around it falls is a hallmark of a fearful, discerning market where traders are not willing to spray capital indiscriminately.
The 10-year Treasury yield ticked up to 4.86%, adding a subtle but real headwind for risk assets. With the DXY flat at 101.67 and gold holding at $4,147, the macro picture is not screaming crisis — but a 10-year yield pushing toward 5% historically applies pressure on long-duration risk assets, and crypto sits squarely in that category. Bond markets are sending a quiet message about where rate expectations sit heading into the CPI print.
Altcoin Action
Ethereum was the headline underperformer, dropping 4.06% to $2,133 after trading as high as $2,225 during the session. Volume of roughly $2.47 billion underscores that this was not a low-liquidity drift — sellers were active. ETH’s beta to negative crypto sentiment remains elevated, and with BTC dominance at 59.6%, the market is clearly not in a mood to reward altcoin risk right now.
Solana fell 2.68% to $86.61, holding above the $84.92 session low but failing to reclaim $89. DOGE slipped 1.27% to $0.0700. Among named movers, PIEVERSE surged 39.7% and JUP gained 7.0%, while VVV added 6.4% — all likely driven by isolated catalysts rather than broad momentum. On the losing side, RAIN dropped 12.5%, BTW fell 12.3%, and PEARL shed 6.5%, reflecting the indiscriminate selling that tends to hit lower-liquidity names when sentiment deteriorates.
Formation Securities also made headlines with plans for a Solana-based stock trading venue under an SEC exemption, a development that could matter longer-term for SOL utility — but it did not arrest today’s price slide. PNC Bank’s test of converting USDC payments into dollar deposits is another quiet piece of institutional infrastructure building that the market barely noticed amid the noise.
Positioning and the Liquidation Map
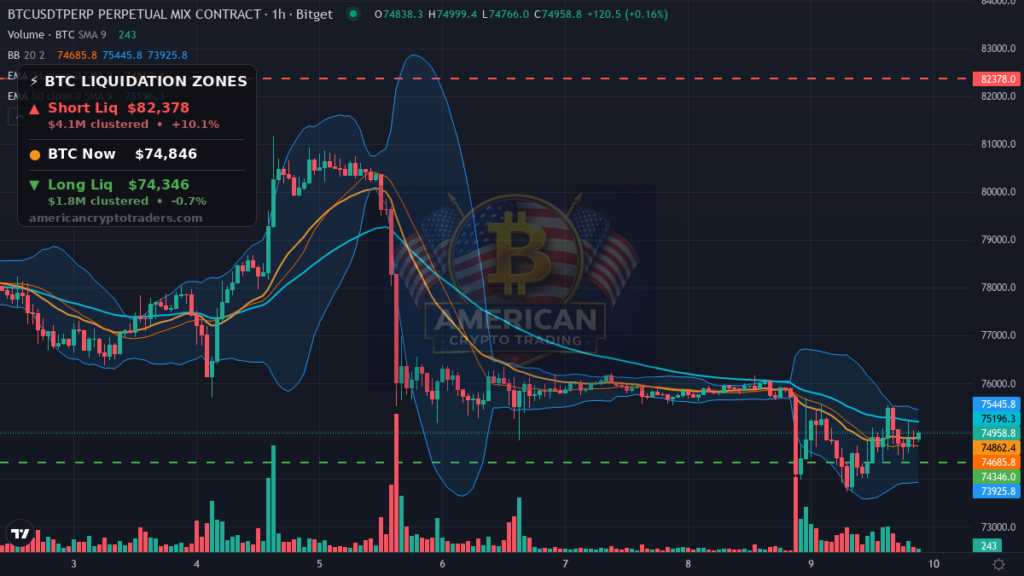
With BTC printing near $74,846 at the time liquidation data was pulled, the positioning picture is asymmetric. Long liquidations cluster at $74,346 — just 0.7% below the current price, representing approximately $1.78 million in leveraged longs that get flushed if sellers push through that level. That is a thin cushion, and a move through it in the Asia session on thin books could cascade quickly.
Short liquidations are stacked at $82,378, roughly 10.1% above current price, representing about $4.05 million in short exposure. A break above that level would trigger a meaningful squeeze, but getting there requires a sustained catalyst — the CPI print is the most obvious candidate. Until then, the path of least resistance based on the liquidation map leans slightly toward testing the downside first.
Funding rates are mildly positive — BTC at 0.0086% and ETH at 0.005% — suggesting the market is not dramatically overleveraged long, which limits the fuel for a forced cascade lower but also means there is no short-squeeze pressure building yet from funding alone.
The Macro Picture
The dominant macro event looming over every chart right now is the U.S. CPI report dropping during the Asia-London session overlap. BTC has been coiled in a $73,000–$76,000 range, and an inflation print that surprises to the downside could give the Fed cover to pivot dovish — a scenario that would likely be the catalyst to break price out of that compression to the upside. A hot print, conversely, could validate the yield pressure already building at 4.86% on the 10-year and push BTC toward the lower end of its range.
The DXY holding flat at 101.67 and gold unchanged at $4,147 suggest the broader macro market is in a wait-and-see posture ahead of the number. That patience is a reasonable model for crypto positioning as well.
Levels to Watch
On the downside, $74,346 is the immediate line in the sand where leveraged long liquidations concentrate — a close below that level during the Asia session would put the $73,408 session low and then the psychological $73,000 handle in play. A sustained break under $73,000 opens the door to the range lows that analysts have flagged, with one bear-case target at $68,000 circulating in research notes today.
To the upside, $75,720 — today’s 24-hour high — is the first resistance to reclaim. Above that, the market needs to clear $76,000 convincingly before the $82,378 short liquidation cluster becomes a realistic target. Watch for volume confirmation on any breakout attempt; a low-volume push into resistance ahead of CPI is likely to be faded.
Upcoming Catalysts
The U.S. CPI report is the singular scheduled catalyst on the immediate horizon, dropping during the Asia-London session overlap — the highest-impact macro data point of the week and the most likely trigger to resolve BTC’s current range compression in either direction.
Sentiment Check
The Fear & Greed Index sits at 29 — Fear. That reading is consistent with everything price action is communicating today: capital defensive, flows selective, and risk appetite for altcoins nearly absent. Fear readings in this zone historically mark periods where patient buyers have found edge, but they can persist and deepen before reversing — particularly when an external catalyst like a CPI print is pending.
For a longer-term perspective on where November’s monthly candle stands within Bitcoin’s historical pattern, see our 28-for-28 monthly candle analysis. The macro setup will ultimately determine whether the bulls can defend the structure that longer-term signals point toward.
Bottom Line
Today’s session was a textbook example of crypto-specific weakness overriding a broad macro tailwind. The S&P surged, but BTC drifted and ETH got hit hard. The Binance hack aftermath is keeping sentiment defensive, BTC dominance is climbing as capital hunkers down, and the entire market is essentially treading water waiting for the CPI print to set the next direction.
The liquidation map tells you the near-term risk is a dip toward $74,346 before any squeeze toward $82,378 becomes plausible. If CPI comes in soft, that calculus flips quickly. If it runs hot, the $73,000 level needs to hold or the range breaks lower. Position sizing and patience are the tools for this environment — not conviction bets in either direction ahead of a binary macro event on thin holiday-adjacent books.
Disclaimer: This recap is for educational and informational purposes only and does not constitute financial advice. Cryptocurrency trading involves substantial risk of loss. Always do your own research. American Crypto Traders and its contributors may hold positions in the assets discussed.