Bitcoin Market Recap: Monthly Close Approaches Under Bond Yield Pressure
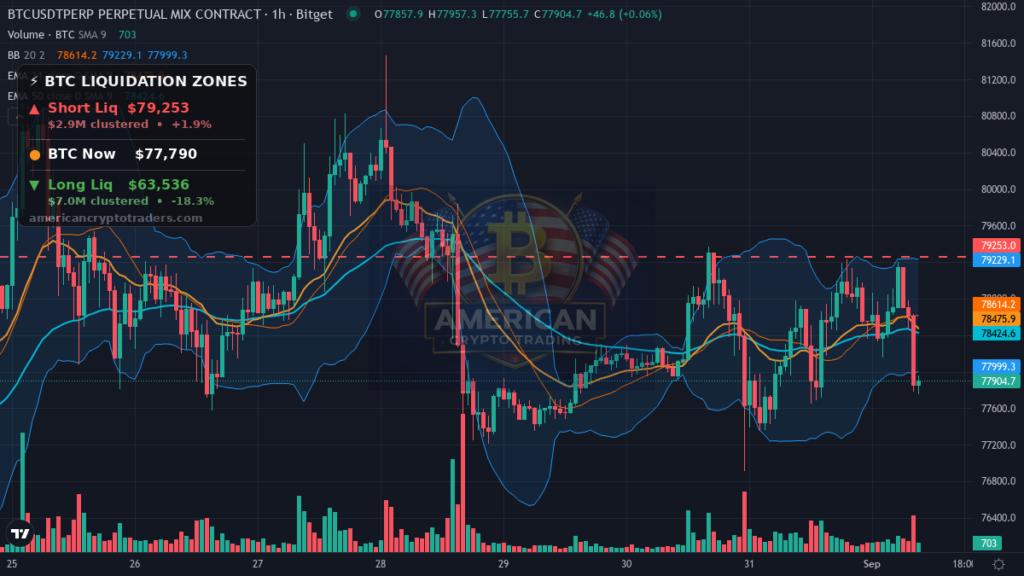
As we gear up for the New York session, Bitcoin currently sits at $77,904, down 0.91% over the past 24 hours after selling off overnight from a high of $79,231 to a session low of $77,646 as U.S. 10-year Treasury yields pushed toward 4.76%, a level not seen in roughly two decades. Today also marks the monthly close for September 1 — meaning the candle that prints in the hours ahead carries outsized technical significance. The tape into the NY open is under pressure, and with bond markets at historically sensitive levels, traders should expect elevated volatility.
What Moved Markets Overnight
U.S. 10-year Treasury yields climbed to 4.76%, approaching 20-year highs, and the pressure bled directly into crypto. When risk-free rates rise to these levels, the opportunity cost of holding speculative assets like Bitcoin increases sharply, prompting institutional desks to trim exposure. The result was a roughly $1,585 drawdown in BTC overnight, and total crypto market cap fell 3.0% to $2.62 trillion — a broad-based deleveraging consistent with a classic risk-off bond yield shock.
Despite the spot weakness, BlackRock-led Bitcoin ETF flows posted a $217 million single-day rebound, and XRP ETFs extended their inflow streak to nine consecutive days, accumulating $1.6 billion since launch. This bifurcation between spot price weakness and sustained ETF inflows is meaningful: it suggests institutional buyers are treating the dip as an entry opportunity rather than a reason to exit. Persistent inflows during a drawdown historically act as a demand floor that can slow or reverse spot declines when equities stabilize.
On the corporate treasury front, Strive added $143 million in Bitcoin while Bitmine accumulated 53,500 ETH, now controlling 4.9% of Ethereum’s circulating supply. The Bitmine accumulation in particular is notable — concentrating that much ETH at current prices represents a significant directional bet on Ethereum’s value accrual. Corporate accumulation at lower price points reduces the available liquid supply and can amplify moves to the upside once selling pressure exhausts itself.
Altcoin Action
The clearest theme overnight was a rotation out of majors and into L2 and DeFi tokens. ARB surged 26.2%, CRV gained 13.9%, and UNI added 10.5% — all three are governance or utility tokens tied to decentralized finance infrastructure. When Bitcoin bleeds but DeFi outperforms, it often signals that sophisticated, risk-tolerant capital is repositioning rather than retreating entirely.
ETH held notably flat at $2,451, with a 24-hour range of $2,436 to $2,489 and a marginal gain of 0.19%. Bitmine’s continued ETH accumulation likely provided a bid under the asset even as BTC declined. SOL slipped 0.99% to $102.08, trading in a tight range between $101.70 and $104.96, consistent with a market that hasn’t committed to a directional move in the second-layer narrative yet.
On the downside, MNT led losers at -5.5%, followed by BTW at -5.4% and LIT at -4.4%. These are modest losses compared to the DeFi gains and suggest the altcoin complex is experiencing genuine rotation rather than uniform selling. BTC dominance sits at 59.6%, which remains elevated and reflects continued preference for the relative safety of the leading asset even during a pullback.
Positioning and the Liquidation Map
Funding rates on both BTC and ETH are sitting at a neutral 0.0001%, which tells us the derivatives market is not overextended in either direction — there is no crowded long or short trade to unwind mechanically. That neutral funding in the context of overnight selling suggests the move lower was driven by spot sellers responding to macro signals rather than a leveraged long flush.
The liquidation map heading into the NY open tells a more nuanced story. Short liquidations cluster at $79,253 — a level roughly 1.9% above the current price. A push through that level would force short sellers to cover, potentially accelerating a squeeze back toward the overnight high. Conversely, long liquidations pool at $63,536, which is 18.3% below current levels. A break of that support would trigger a cascading long unwind and represent a serious structural deterioration in the chart. The asymmetry here matters: the squeeze trigger is close, but the catastrophic flush level provides a wide buffer for bulls to work with.
The Macro Picture
The macro backdrop is delivering mixed signals. The DXY dollar index edged up 0.13% to 99.56, a modest strengthening that historically acts as a headwind for dollar-denominated risk assets including crypto. Gold slipped slightly to $4,424.70, down 0.14%, suggesting the flight-to-safety bid is not overwhelming — markets appear stressed but not panicked.
The S&P 500 futures closed the prior session at 7,686.14, down 0.33%, which aligns with the mild risk-off tone across asset classes. The dominant driver remains the 10-year yield at 4.76% — if that level holds or continues climbing when NY desks arrive, expect continued headwinds for BTC into the monthly close. Any pullback in yields could provide the relief catalyst that helps Bitcoin recover from overnight lows.
Levels to Watch
To the upside, traders should watch $79,253 — the short liquidation cluster. A clean break above that level into the NY session opens the door for a short squeeze back toward $79,500 and potentially reclaiming the $80,000 handle. The overnight high of $79,231 serves as the immediate resistance reference before that target.
To the downside, the overnight low of $77,646 is the first line of defense. A failure to hold that level on NY open could invite a test of $77,000 and ultimately $75,000 as the next meaningful support zone. The long liquidation wall at $63,536 is a tail risk, not an immediate target — but it is the level where a true structural break would become a cascade rather than a correction.
Upcoming Catalysts
The macro calendar is relatively quiet for today’s session, leaving the monthly close itself as the primary event. With no major scheduled data releases in the immediate pipeline, price action will likely be driven by bond yield movements, any incremental ETF flow data, and the technical mechanics of the monthly candle close.
Sentiment Check
The Fear & Greed Index reads 69, which places sentiment firmly in Greed territory. That reading feels disconnected from the overnight selling, and that disconnect is worth respecting — when sentiment is greedy and price is falling, it often means participants haven’t fully adjusted their expectations to match the tape. A monthly close under pressure while the crowd remains greedy is historically a setup worth monitoring closely; see our 28-for-28 monthly candle analysis for context on why monthly closes carry such technical weight.
Bottom Line
Bitcoin enters today’s critical monthly close at $77,904, pressured by 10-year Treasury yields at 4.76% and a risk-off macro tone, but supported by $217 million in ETF inflows and continued corporate accumulation from Strive and Bitmine. The DeFi rotation in ARB, CRV, and UNI signals that sophisticated capital is repositioning rather than fleeing. Neutral funding rates and a wide buffer above the long liquidation level at $63,536 suggest the structure isn’t broken — but the monthly candle needs to print above key support when NY desks arrive to preserve the bullish case. Watch the 10-year yield and that $79,253 short squeeze trigger closely into the open.
Disclaimer: This recap is for educational and informational purposes only and does not constitute financial advice. Cryptocurrency trading involves substantial risk of loss. Always do your own research. American Crypto Traders and its contributors may hold positions in the assets discussed.