Bitcoin Market Recap: Yields Bite, Alts Bleed Harder
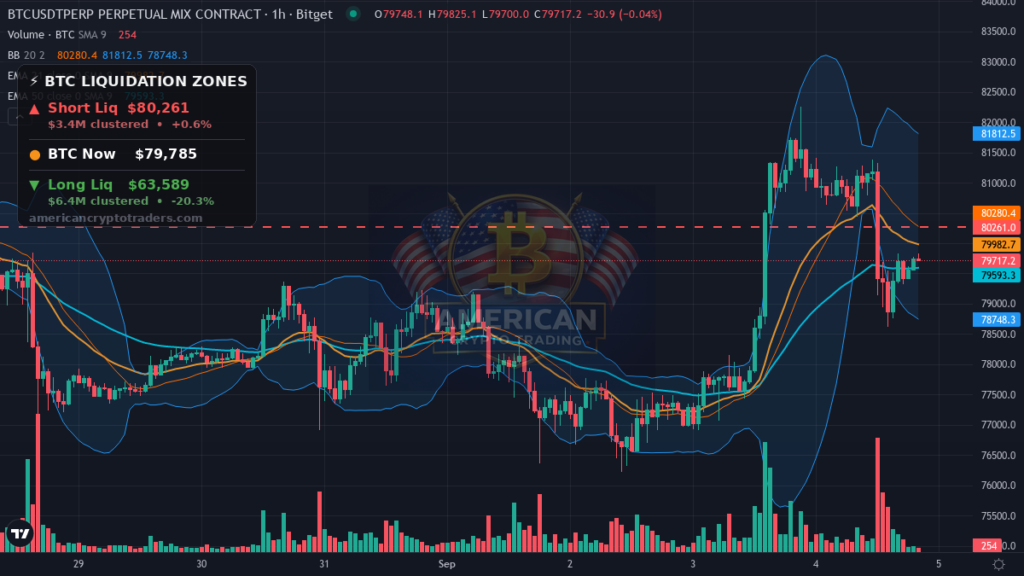
Thursday’s bitcoin market recap tells a familiar macro story: when the bond market sneezes, risk assets catch a cold. BTC finished the New York session at $79,717, down 2.17% on the day, printing a 24-hour range of $78,613 to $82,248. The move was orderly rather than panicked, but the macro catalyst behind it was anything but mild.
The total crypto market cap shed 4.52% across the session, confirming that altcoins absorbed the bulk of the pain while Bitcoin held its relative footing. BTC dominance held firm at 59.2%, a level that signals capital is rotating toward the perceived safety of the largest asset in the space rather than chasing risk further down the cap stack.
What Moved Markets Today
The US 10-year Treasury yield surged to 4.78%, its highest level in recent memory, rising 0.46% on the session. Higher yields raise the opportunity cost of holding non-yielding risk assets — equities and crypto alike. When real money can earn nearly 5% risk-free, leveraged longs in volatile assets face immediate repricing pressure. The S&P 500 closed at 7,718.6, off 0.38%, confirming the risk-off tone was not crypto-specific but a broad de-risking event across asset classes.
Revolut and a16z-backed OpenReserve each received preliminary US bank charters with explicit crypto mandates — a meaningful structural development for institutional infrastructure. In isolation, either approval would have been a constructive headline. Today, however, the macro environment overwhelmed the positive regulatory signal, and price barely budged in response. Markets priced it as a long-term positive for institutional rails rather than an immediate catalyst for spot buying — a rational read given the yield backdrop.
Zcash surged approximately 6.9% and DASH exploded 19.6%, leading a sharp privacy-coin squeeze that ran directly against the broader downtrend. The move appears driven by a short squeeze dynamic: privacy tokens had been heavily shorted heading into the session, and when BTC’s decline failed to accelerate into a full cascade, covering pressure lit the fuse in smaller, thinly traded names. LIT also gained 12.8%, suggesting the bid was sector-wide rather than asset-specific. These moves should be read as technical rather than fundamental unless a concrete catalyst emerges.
Altcoin Action
The altcoin complex had a rough Thursday. SOL dropped 3.55% to $101.57, sliding below the psychologically important $102 level and testing $100.10 at the session low. Ethereum fell 2.27% to $2,452, with a 24-hour range of $2,428 to $2,546 — ETH is holding above $2,400 for now, but the daily close was not encouraging.
DOGE led the large-cap losers with a 4.68% decline to $0.0846, consistent with its pattern of amplifying BTC drawdowns. Among named losers, BTW fell 9.4%, JUP dropped 8.9%, and FIL shed 6.0%. The pattern is clear: when macro risk-off hits, liquidity drains from the lower cap names fastest, and the session today was no exception.
The privacy coin exception — ZEC, DASH, LIT all green on a sea of red — is worth noting as a potential rotation signal, though traders should treat single-session squeezes with caution. Zcash headlines referenced the asset hitting its highest price in nearly a decade, which likely attracted momentum traders and added fuel to the short-covering move.
Positioning and the Liquidation Map
BTC funding on perpetual swaps flipped slightly negative at -0.0015%, indicating that short-side positioning is paying a modest premium to hold — a mild signal that the market is leaning bearish in the near term. ETH funding remained modestly positive at +0.0073%, suggesting longs are still paying to hold ETH exposure despite the day’s losses.
The liquidation map paints an asymmetric picture around current prices. On the upside, $80,261 is the key short liquidation level — approximately 0.6% above current price. A push through that level would begin triggering short liquidations totaling roughly $3.4 million, which could produce a brief but sharp squeeze back toward the daily high. On the downside, the critical long liquidation cluster sits at $63,589, roughly 20.3% below current price. A sustained breakdown toward that zone would represent a cascading flush of approximately $6.4 million in long positions — a scenario that would likely coincide with a full macro deterioration, not just a yield spike. Neither scenario appears imminent, but traders should know where the landmines are buried.
The Macro Picture
The DXY dollar index edged up 0.16% to 99.16, holding below the 100 handle — a level that, if reclaimed, would add another headwind for crypto and commodities priced in dollars. Gold slipped 0.31% to $4,477.90, a notable data point: when yields rise sharply and gold also sells off, it suggests genuine de-risking across the board rather than a flight-to-safety rotation.
The macro overhang is squarely the bond market. The US 10-year at 4.78% is not catastrophic in isolation, but the rate of change — up 0.46% in a single session — is the stress signal. If Asia hours see further yield expansion, whether driven by Japanese market dynamics or a weak Treasury auction result, expect additional crypto pressure. Watch the 10-year closely during the overnight session.
Levels to Watch
To the upside, the immediate resistance cluster is $80,261 — the short liquidation trigger — followed by the 24-hour high at $82,248. A reclaim of $80K and then $80,261 with volume would signal that dip buyers are stepping in and could initiate a short-covering squeeze.
To the downside, $78,613 is the session low and the first line of defense. Below that, the $77,000–$78,000 zone has served as support in recent weeks. A clean break below $78,613 in Asia or London hours would increase the probability of testing $75,000, with the long liquidation cascade zone at $63,589 serving as the extreme bear scenario. Position sizing accordingly.
Upcoming Catalysts
The macro calendar is relatively quiet heading into the Asia and London opens, with no major scheduled data releases immediately on deck. The primary catalyst to monitor is any further movement in US Treasury yields during overnight trading, as that single variable drove today’s session more than any crypto-native event. Regulatory developments around the newly chartered crypto-friendly banks — Revolut and OpenReserve — could generate headlines, but are unlikely to move spot price in the near term.
Sentiment Check
Despite today’s 2.17% BTC decline and the broader 4.52% market cap flush, the Fear & Greed Index sits at 74 — Greed. That reading is a yellow flag. When the market sells off on elevated sentiment, it suggests participants have not yet fully repriced the risk, and dip buyers may be too eager. A healthy reset toward Neutral (50) would actually create a more durable base for the next leg. For longer-term context on how monthly candle structure maps to cycle positioning, see our 28-for-28 monthly candle analysis.
Bottom Line
Today’s session was a clean macro-driven flush, not a crypto-specific breakdown. The US 10-year yield at 4.78% is doing real work as a headwind, and until that rate stabilizes or retreats, the path of least resistance for risk assets remains sideways to lower. BTC held better than alts — dominance at 59.2% confirms that — but $79,717 is not a comfortable position with yield risk still elevated heading into Asia.
The privacy coin squeeze in DASH and ZEC is an interesting internal market signal worth monitoring, and the bank charter news for Revolut and OpenReserve is a genuine long-term structural positive. Neither changes the near-term tape. Keep position sizes measured, know your liquidation levels, and watch the 10-year in the overnight session.
Disclaimer: This recap is for educational and informational purposes only and does not constitute financial advice. Cryptocurrency trading involves substantial risk of loss. Always do your own research. American Crypto Traders and its contributors may hold positions in the assets discussed.